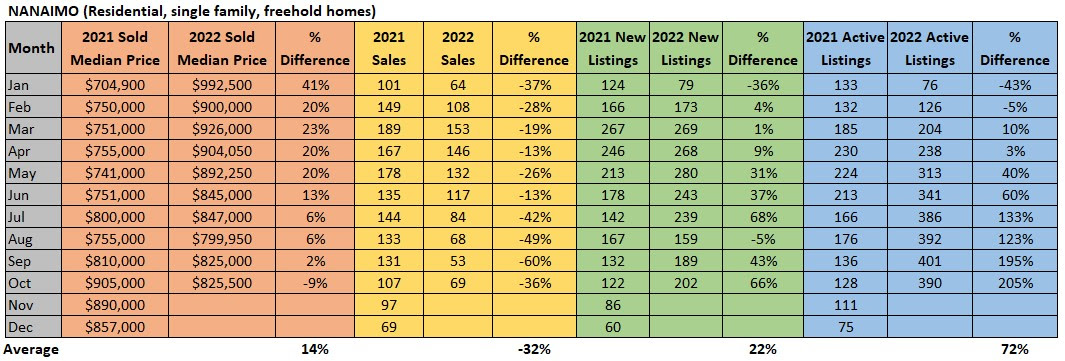
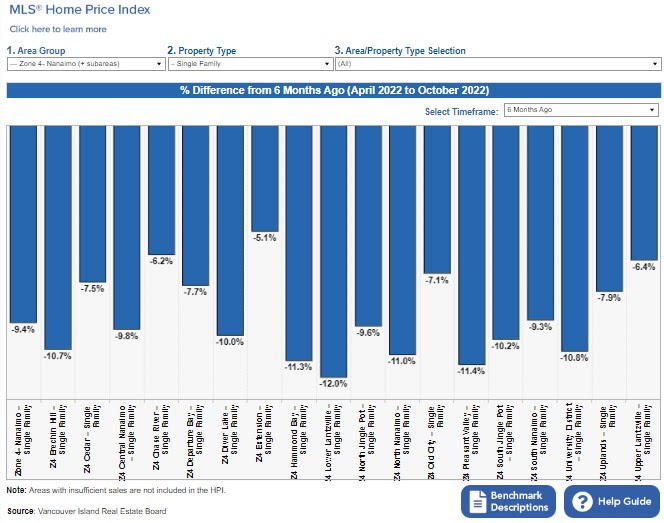
The BC Assessments valuations on your homes are now out and as expected show an increase in most of the regions on the Island. The only areas not to see an increase were the Villages of Port Alice, Tahsis and Zeballos.
Nanaimo saw a 12% increase in a typical assessed median value for a single family home and the following table shows the complete list for the Central Island area:
See https://info.bcassessment.ca/news/Pages/Vancouver-Island-2023-Property-Assessments-in-the-Mail.aspx for the full Island list.
Although these are the 2023 values, they are based on the homes assessed value as of July 1, 2022 so are always out of date and by the end of the current year will be 18 months old. Therefore they can never really be a true reflection of the homes current market value - espcially in...


