

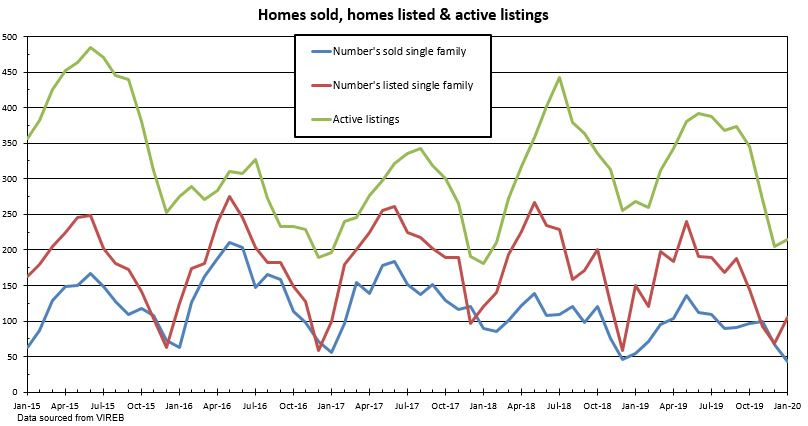
Although the number of active listings in Nanaimo is lower than January 2019 it is still slightly higher than we saw in January 2017 and 2018 but lower than January 2016 and 2019. It is the lowest number of homes sold in the last 5 years, although is the same as January 2013 and slightly higher than January 2009. We should see the number of homes listed and sold increase now we are past January, although the weather can still have an influence on those numbers as we saw during our week of snow!
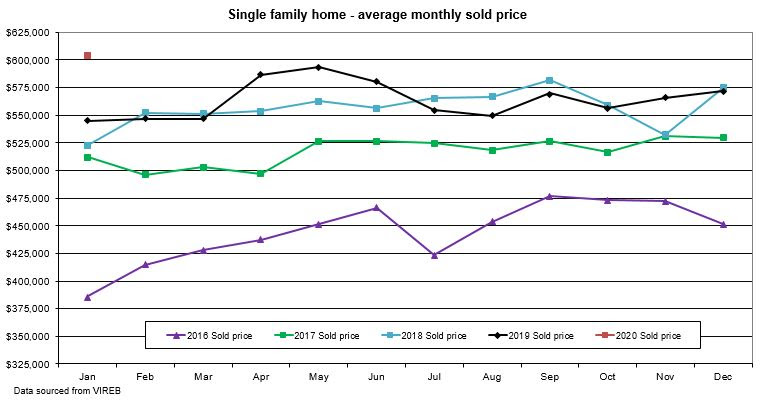
Price wise the average for Nanaimo was a record, although I think this is likely to have been an anomaly due to the low number of sales and there were also some sales of homes priced over $1m which can skew the figures.
Real Estate Statistics for January 2020
| January 2020 | December 2019 | January 2019 | ||
| Nanaimo | ||||
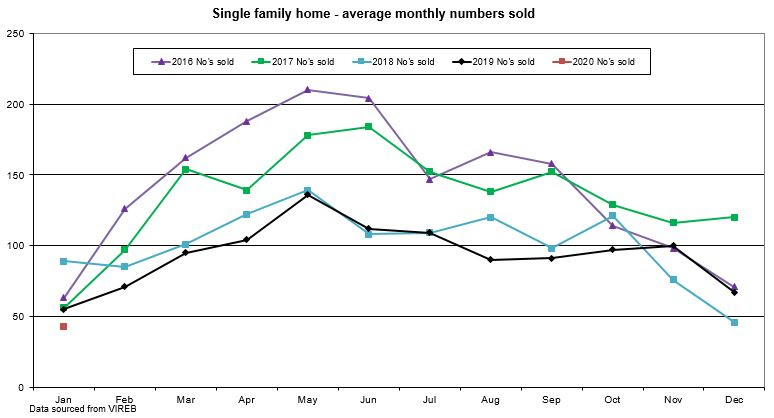
| Unit Sales: | 43 | 67 | 55 | |
| Average Sale Price: | $603,720 | $571,519 | $545,447 | |
| Parksville / Qualicum | ||||
| Unit Sales: | 34 | 31 | 29 | |
| Average Sale Price: | $637,968 | $731,448 | $589,015 | |
Parksville/Qualicum home sales increased 17% in January 2020 when compared with January 2019. The average sale price increased 8%. The median house price was $595,000.
In Nanaimo for January 2020 there were 215 active listings of single family freehold homes, which is 19% lower then January 2019.
The graphs below are for Nanaimo and show the average sold numbers and average sold price since 2016 (single family homes only.)

As always I hope you find these monthly newsletters informative and if at any time you or any of your friends, relatives or co-workers are looking for a professional realtor to help them buy or sell a home, or just have a real estate question, please call my personal cell, 250-739-1228, or drop me an email.
Thank you,
Ian


Comments:
Post Your Comment: