

Real Estate Statistics for September 2018
| September 2018 | August 2018 | September 2017 | ||
| Nanaimo | ||||
| Unit Sales: | 98 | 120 | 152 | |
| Average Sale Price: | $582,115 | $566,795 | $526,392 | |
| Parksville / Qualicum | ||||
| Unit Sales: | 42 | 67 | 64 | |
| Average Sale Price: | $575,763 | $604,254 | $598,188 | |
Parksville/Qualicum home sales decreased 34% in September 2018 when compared with September 2017. The average sale price decreased 4%. The median house price was $557,400.
Synopsis
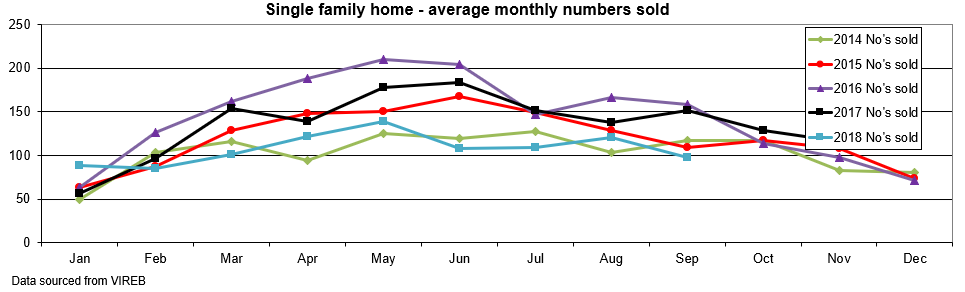
In Nanaimo for September 2018 there were 364 active listings of single family freehold homes, which is 13% higher then September 2017.
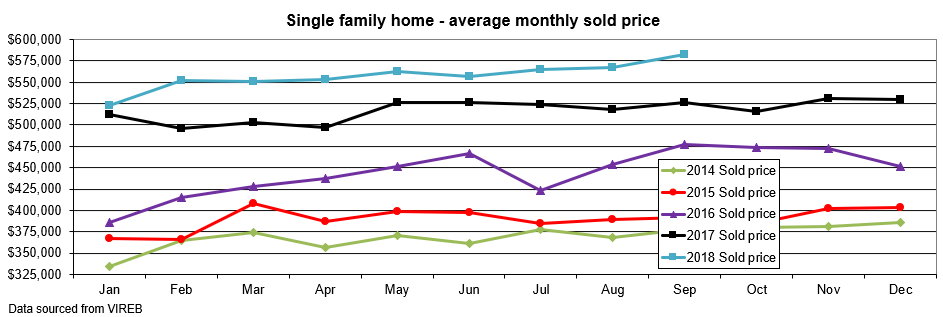
The graphs below are for Nanaimo and show the average sold numbers and average sold price since 2014 (single family homes only.)
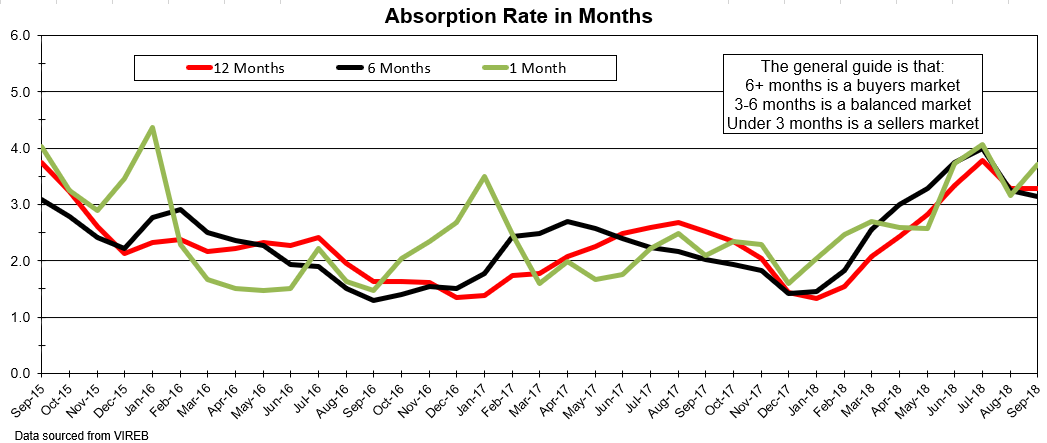
The following graph shows what is called the absorption rate. This is the time it would take the current homes for sale, to sell, if no new homes were listed, which indicates whether we have a sellers, balanced or buyers market. The 3 rates are based on 1, 6 and 12 months of sales data.
These figures do concentrate on single family homes but if you would like similar information for other property types, such as apartments or patio homes, or specific geographical areas of Nanaimo or Parksville/Qualicum, then I would be more than happy to discuss those with you as well.
As always I hope you find these monthly newsletters informative and if at any time you or any of your friends, relatives or co-workers are looking for a professional realtor to help them buy or sell a home, or just have a real estate question, please call my personal cell, 250-739-1228, or drop me an email.
Thank you,
Ian Hodson


Comments:
Post Your Comment: